|
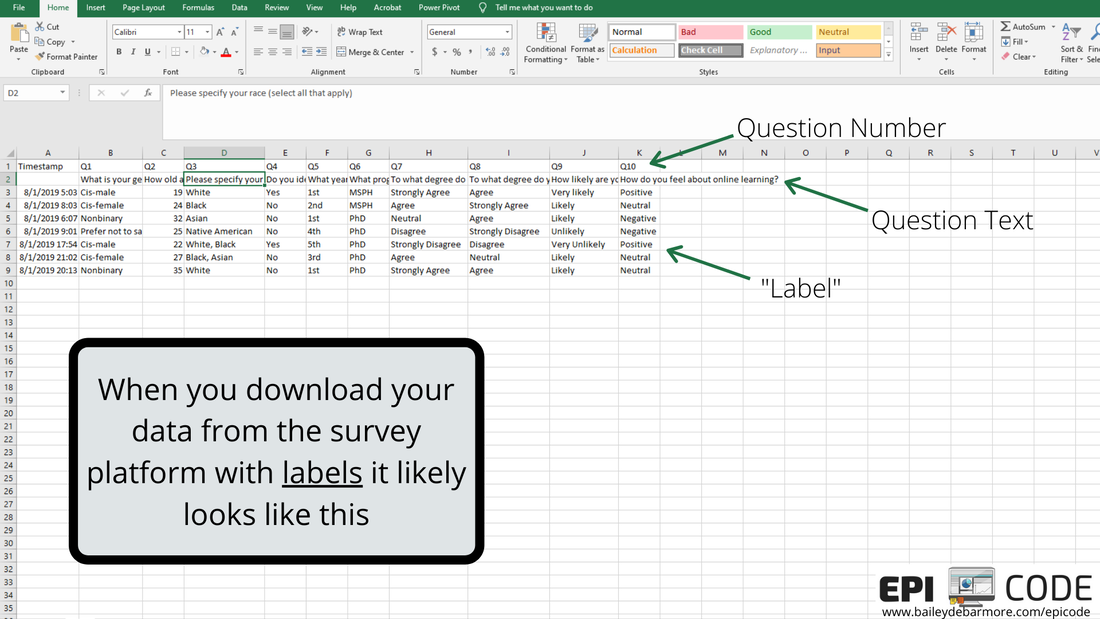
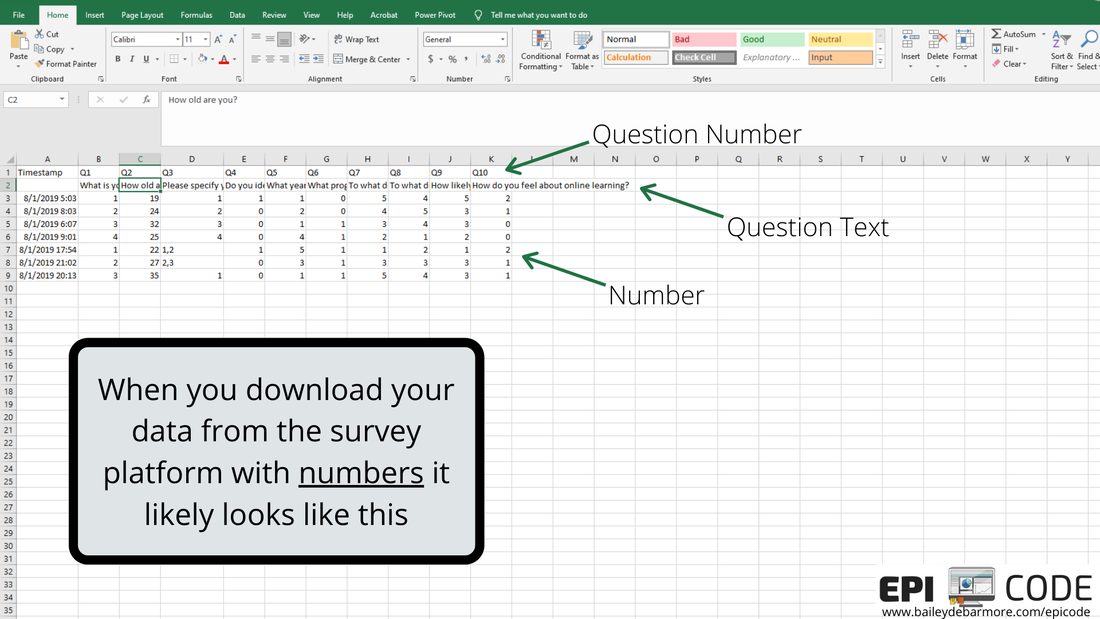
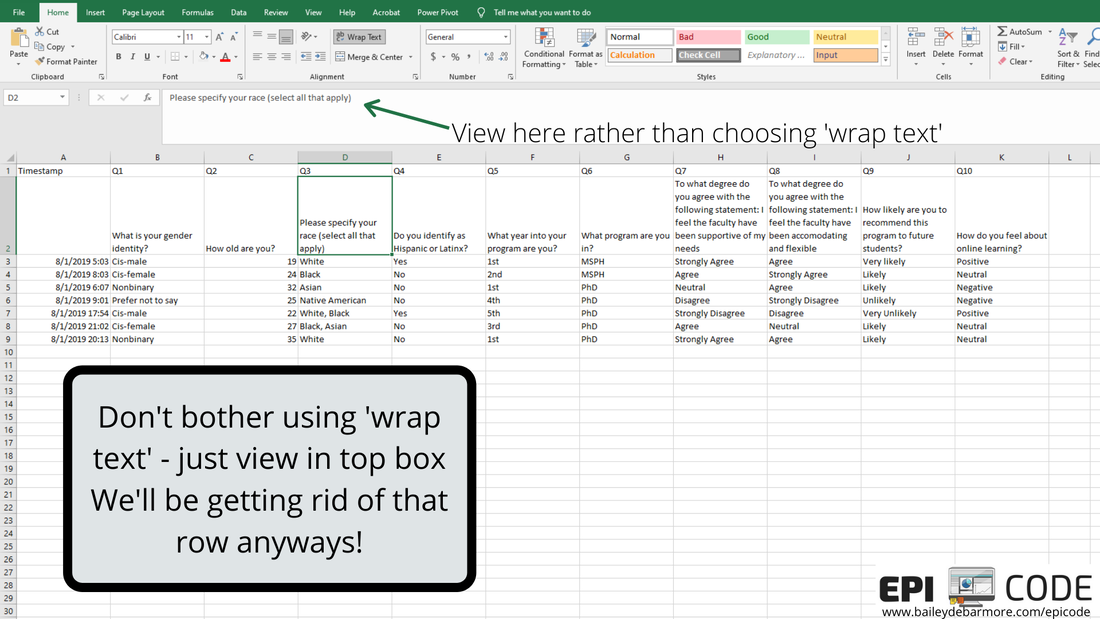
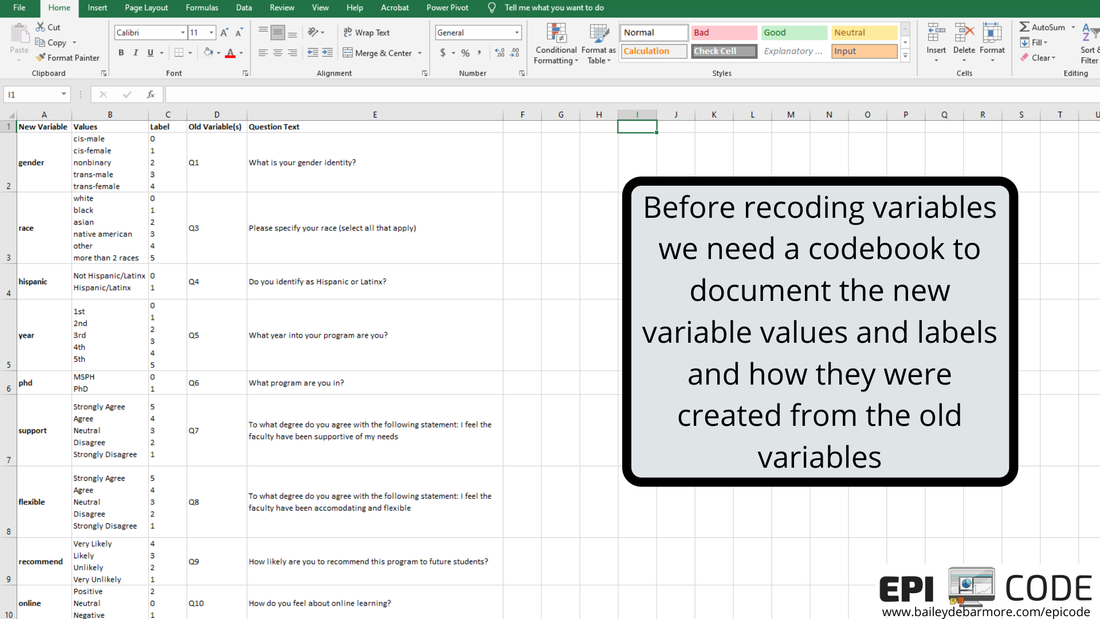
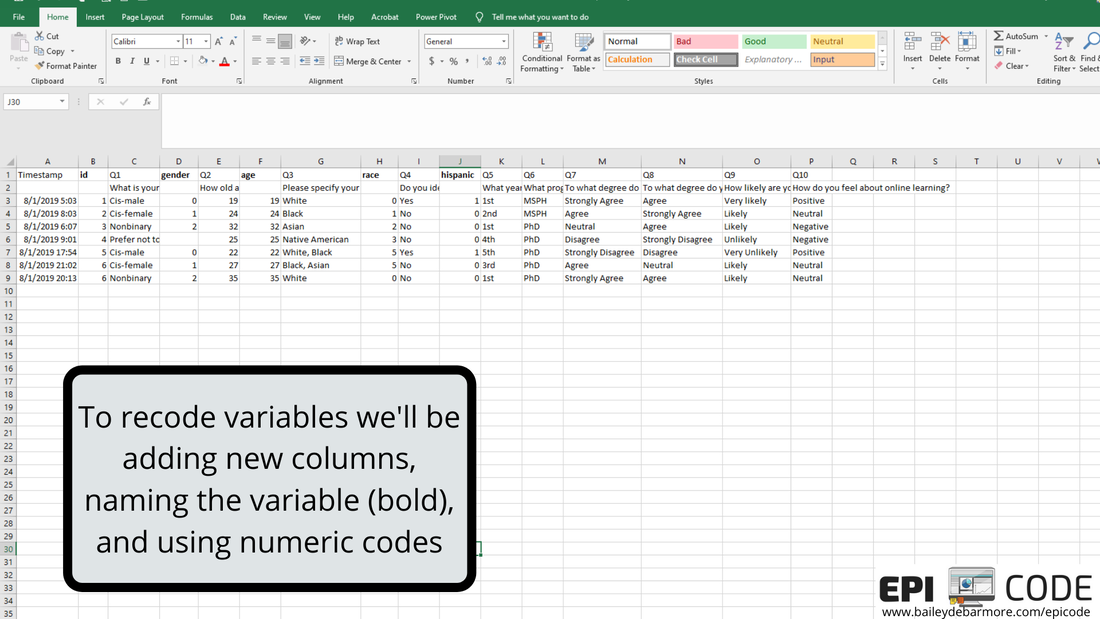
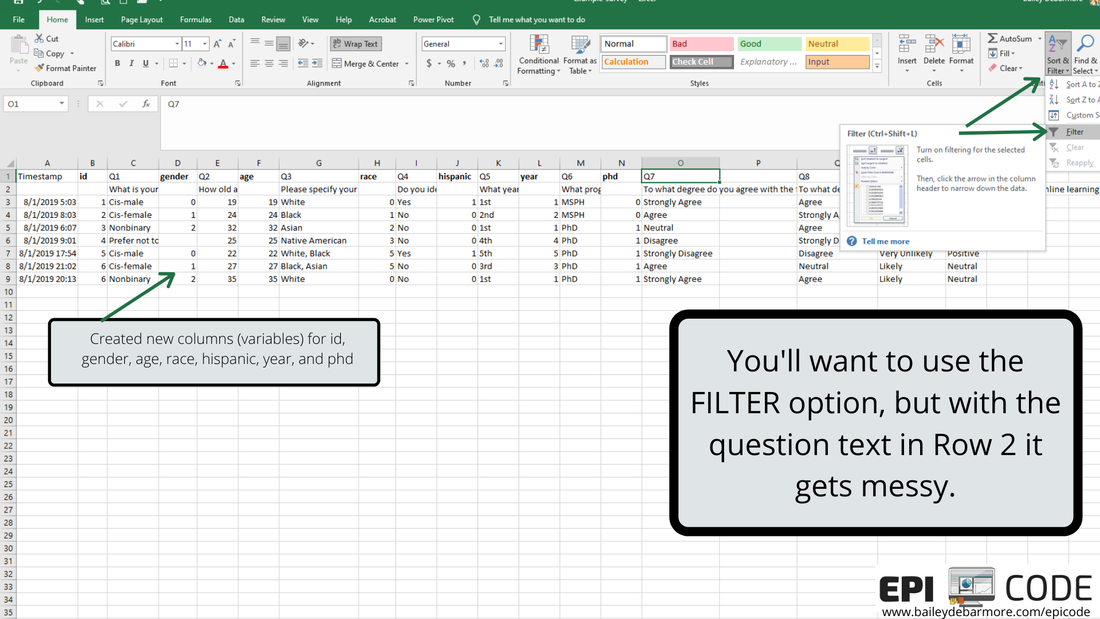
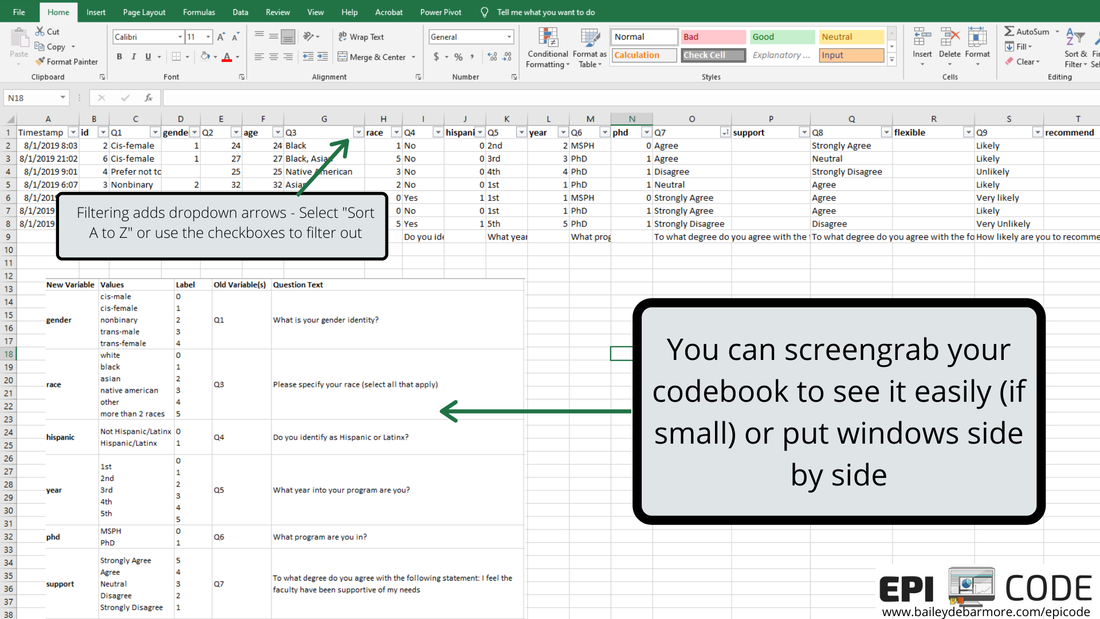
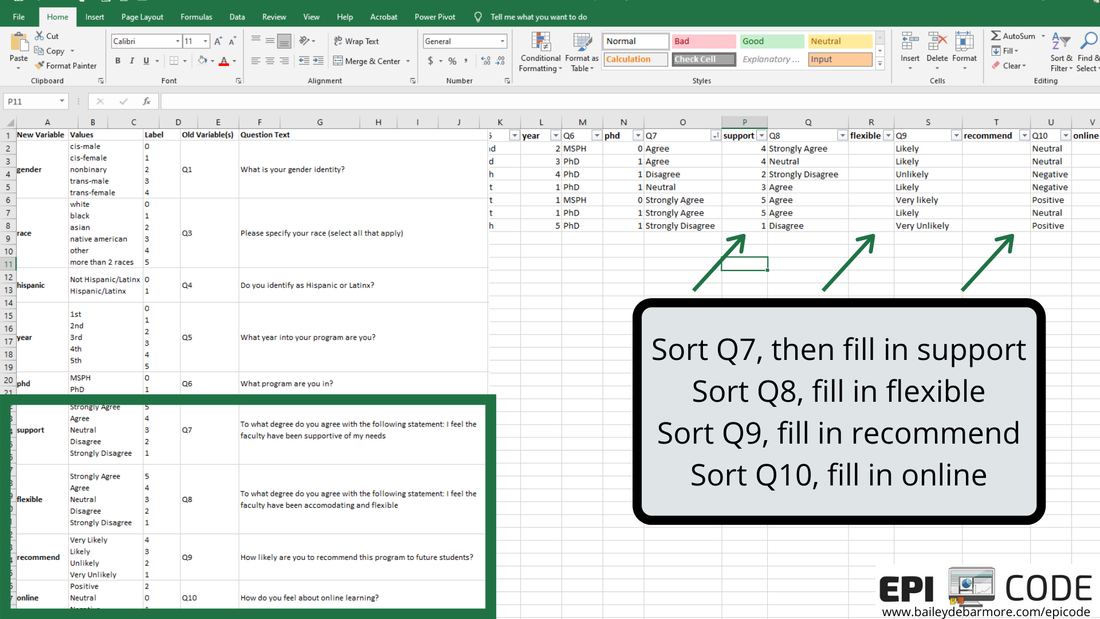
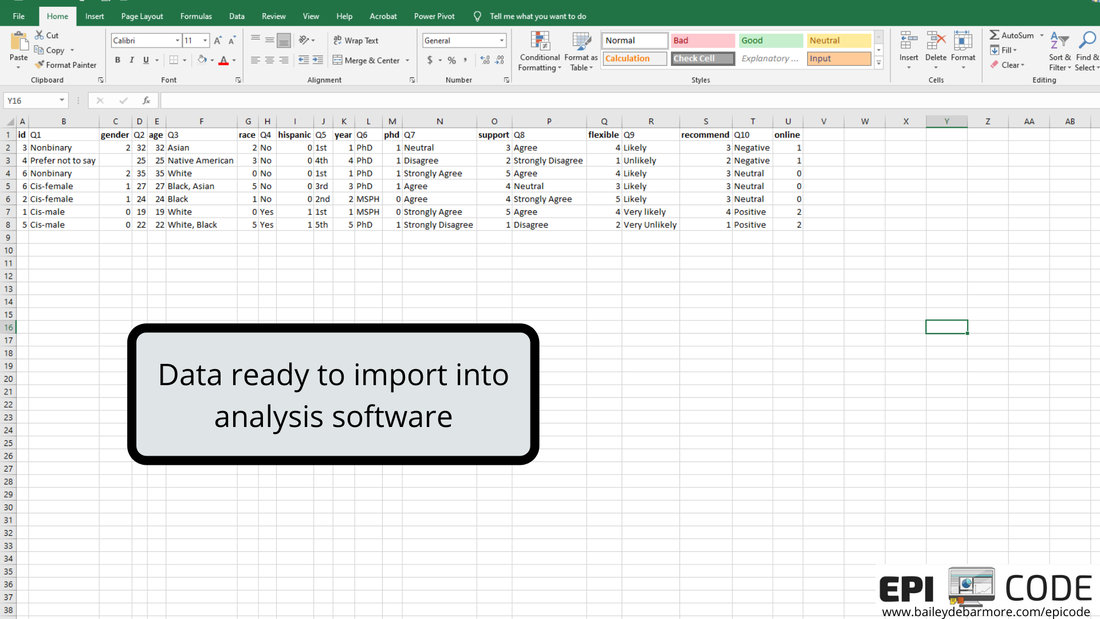
Author: Bailey DeBarmore A task I often help with is getting survey data prepped for data analysis. Typically a client has distributed a written survey via Qualtrics or SurveyMonkey, and has downloaded the survey results to Excel as an xls, xlsx, or csv. Before importing that data into Stata, SAS, or R, [read that post here] there are a few steps you should do first. In this short tutorial post, I'll walk you through those steps. I highly recommend reading through this post in full before touching your data. Get an overview of what you'll need to do and then read through again to let the gears turn on how you'll need to clean your own data. Feel free to post any questions in the comments! Let's get started. The screenshots used in this short tutorial are provided in slideshow form below as well as with associated text in the post. download your data from the survey platformIf you haven't already, download your data from the survey platform that you used (e.g., Qualtrics, SurveyMonkey). You may have the option to download it WITH LABELS or AS NUMBERS. The photos below show you what that means. Basically, with labels, means that if you asked respondents "How much do you agree with this statement?" and the options were Strongly Agree, Agree, Neutral, Disagree, Strongly Disagree, downloading the data with labels would export those terms while downloading the data with numbers would turn that into 1, 2, 3, 4, 5, or 5, 4, 3, 2, 1. I recommend downloading WITH LABELS and then recoding yourself. You may have columns for timestamp (like I've simulated here), duration, IP address, etc. etc. etc. You can go ahead and get rid of those columns if you don't need it. You'll see that your question number is in the top row (which we reserve for variable names) with extra information, such as the question text, in row 2. What we'll do next is create a codebook where we can save information like that question text for easy reference as we clean the data. You'll notice that longer text, like your question text, is cut-off. Don't bother using 'wrap text'. Instead, select the sell and view the text in the top box like I've indicated in the image below. We'll be getting rid of that second row anyways, and as you re-code things like perhaps topic coding of qualitative responses, you can easily see the text in the top box. create a codebookIf you haven't done this already, you'll want to make a codebook. You can do this in Excel or a word processor, whichever you prefer. You'll want to include the new variable name, the values, the labels for those values, and the name of the old variable or variables it was created for. In this simple example, you can see that I have the possible values from my survey under "values" and have assigned them a numeric label in column C. I've also copied over the question text so that I can delete it from my data sheet. You will likely want to reference this document while you clean your data, so I suggest making it in a new worksheet or in Word so you can have it side-by-side to your data. You can also screenshot it and paste into your data sheet or print it out. Whatever works for you! recode with new variablesFor each new variable, you're going to insert a new column. You can see that Q1 asked about gender and exported to column C, and I made a new column (column D below), and named that variable (column), gender. Per my codebook (above), cis-male is coded as 0, cis-female as 1, nonbinary as 2, and in this simulated data there were no responses for trans-male or trans-female, but if there were, they would be 3 and 4. I'll talk about filtering and sorting in the next step, so just keep reading before you start changing your data. I made a new variable for Q2, called age, and copied the numbers over. If you were going to create age categories from the age variable, you could do that, too. For race (Q3), respondents could "select all that apply" which is shown in rows 7 and 8. To recode this variable into "race" (column H) I followed the coding in my codebook, where someone that indicated more than one race has a separate category. How you choose to code race and "select all that apply" variables, is up to you and your research question. For binary variables (variables with yes/no options), you want to name the variable so that you inherently know which value is coded as 1. For example, instead of making a variable for Q4 called "ethnicity", I named it "hispanic" so that it's easy for me (and anyone else using my data) to know that data for that variable is coded as 1 = Hispanic/Latinx and 0 = Not Hispanic/Latinx. If you want to make a combined race/ethnicity variable, you could do that here in Excel, or if you're comfortable in SAS, Stata, or R, you can make it later (which is what I would do). Note - I made the new variable names bold just so it was easier for you to see. As we move through the variables, when we have more than 2 or 3 categories it is easier to filter or sort the data rows rather than going row by row assigning different values. If you haven't already, you'll want to get rid of the question text in row 2 because when you go to filter (up at the top - Sort & Filter - Filter), that row will get sorted as well (see second image below). In the image below you can see I went ahead and made new variables for Q5 (year) and Q6 (phd). For year, which was reported as 1st, 2nd, 3rd, 4th, 5th, etc. I coded it as 1, 2, 3, 4 or 5. You may choose to code it has 1st year or older, in which case you would make a variable called "firstyear" with 1 = 1st year, 0 = 2nd year and above. You could make a cut-off at any value, or a categorical variable such as 0 = 1st and 2nd years, 1 = 3rd and 4th years, 2 =- 5th years and above. How you code your variables depends on your research question! The only program options in this example were MSPH (Masters of Science in Public Health) and PhD (Doctorate of philosophy). I chose to make a variable called phd from Q6, but I easily could've made a variable called msph. If I named the variable msph, which value would be coded as 1? 0? I prefer to select the FILTER option, rather than Sort A to Z from the menu, because it adds these little arrows to my first row (header, variables) and I can sort or select from there. Simply click the down arrow next to the variable name (Q3 below) and you'll have options to either Sort, or Select. You can do either. If you Select, for example if I only select PhD for Q6, it will hide rows where Q6 = MSPH. I can then fill in 1 for the rows under column N (phd), and then deselect PhD in column M, select MSPH, and fill in 0 for the rows that show in column N (phd). It's up to you which option you use and you don't always have to use the same one. Because this simulated data set is so small, and the codebook is easy to see on one screen, I used a screenshot to paste it onto my data sheet so it was easy to see what values correspond with what labels. In the image below, I clicked the arrow for Q7, sort A to Z, and filled in the 1 through 5 values in the column next to it (the new variable). Then I repeated that for the remaining questions. ready to analyze the dataHere is my cleaned dataset, ready to import into Stata, SAS, or Excel. You'll want to select options that import your first row as variable names, and it's up to you if you want to keep the original variables (Q1, Q3, etc) or not. If you don't have many variables, you may opt to keep them so that when you browse your data it's easy to see the labels. If you do have a lot of variables, it would be better to make a copy of this sheet, save as, delete those columns, and then import that smaller dataset. Once you're in your software of choice, put your codebook side-by-side and apply labels to the values so it's easy for you to remember and for someone else to understand your data. SAS and Stata have a File > Import function or an Import Wizard that makes importing an xls, xlsx, or csv file easy. They'll produce code in the command window that you can save later to reference. I've included some helpful links below to get you onto this next step. Ready to import your data? Head over to my blog post on Importing your data into SAS, Stata and R.
0 Comments
Your comment will be posted after it is approved.
Leave a Reply. |
Practical solutions for conducting great epidemiology methods. Transparency in code. Attitude of constant improvement. Appreciate my stuff?
All
March 2021
|





 RSS Feed