BAILEY DEBARMORE
  • Home
  • Productivity
    • Blog
    • My Recs
  • EPI
    • EPICODE
    • #EpiWritingChallenge >
      • About the EWC
      • All Posts
  • Wellness
    • Health Blog
    • My Recs
  • Freebies

zEpid: a Python library for epidemiology tools

7/7/2018

0 Comments

 
Author: Paul Zivich
Python is a general computer programming language but has recently garnered popularity among data scientists with its versatility, ability to quickly process large data sets, and large library of machine learning models. I taught myself Python two years ago and while there are several Python libraries for epidemiology, I found the libraries were no longer actively maintained, did not interact with pandas (the main data management Python library), or implement causal inference methods (like inverse probability weights). To fill this gap, I created zEpid with the goal of making epidemiologic analyses in Python e-z.

Functional Form Assessment

I have a few features that I especially like and will highlight them here. First is the functional form assessment. I always found coding functional form assessments to be tedious and difficult to obtain a nice-looking plot from SAS. The code I wrote creates a functional form plot and prints the model results. Below is a fully contained example
​import zepid as ze
import matplotlib.pyplot as plt
df = ze.load_sample_data(timevary=False)
ze.graphics.func_form_plot(df,outcome='dead',var='age0',discrete=True)
plt.show()
​
​Which gives the following output:
​Warning: missing observations of model variables are dropped 
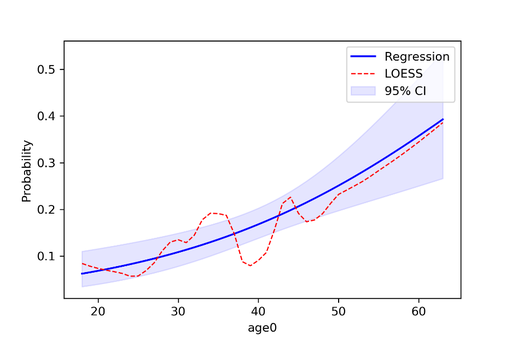
0  observations were dropped from the functional form assessment
                 Generalized Linear Model Regression Results
==============================================================================
Dep. Variable:                   dead   No. Observations:                  547
Model:                            GLM   Df Residuals:                      545
Model Family:                Binomial   Df Model:                            1
Link Function:                  logit   Scale:                          1.0000
Method:                          IRLS   Log-Likelihood:                -239.25
Date:                Tue, 26 Jun 2018   Deviance:                       478.51
Time:                        08:25:47   Pearson chi2:                     553.
No. Iterations:                     5   Covariance Type:             nonrobust
==============================================================================
                 coef    std err          z      P>|z|      [0.025      0.975]
------------------------------------------------------------------------------
Intercept     -3.6271      0.537     -6.760      0.000      -4.679      -2.575
age0           0.0507      0.013      4.012      0.000       0.026       0.075
==============================================================================
AIC:  482.50783872152573
BIC:  -2957.4167585984537
zEpid - a Python library for epidemiology tools

Generate Splines

Assessing other functional forms, creating splines, and adding points which correspond to groups of observations are also easily implementable. Since I mentioned splines, zEpid also has easy to use functionality to generate splines. The following line of code will generate a restricted quadratic spline with knots at 30, 40, and 55. Continuing with the functional form plot code from previous, we can generate another functional form plot
​df[['rqs0','rqs1']] = ze.spline(df,var='age0',n_knots=3,knots=[30,40,50],restricted=True)
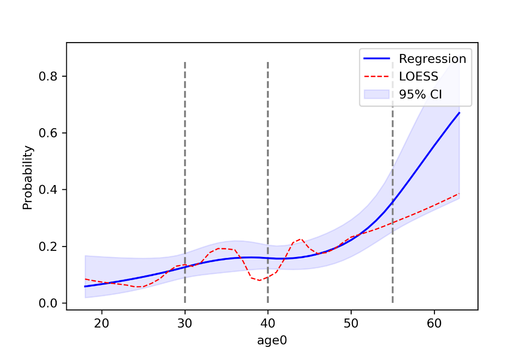
ze.graphics.func_form_plot(df,outcome='dead',var='age0',f_form='age0 + rqs0 + rqs1',discrete=True)
plt.vlines(30,0,0.85,colors='gray',linestyles='--')
plt.vlines(40,0,0.85,colors='gray',linestyles='--')
plt.vlines(55,0,0.85,colors='gray',linestyles='--')
plt.show()
zEpid - a Python library for epidemiology tools

Inverse Probability Weights

​Lastly, zEpid has functionalities for inverse probability weights. Currently, inverse probability of treatment weights, inverse probability of censoring weights, and inverse probability of missing weights are implemented. The following block of code can be used to fit a time-fixed IPTW model. Note that we will use statsmodels to obtain the final result. Currently, zEpid only generates the weights to maintain user functionality (i.e. ability to manipulate weights for a marginal structural model).
​#Loading necessary packages to fit model
import zepid as ze
import statsmodels.api as sm
import statsmodels.formula.api as smf
from statsmodels.genmod.families import family,links
 
#Loading the example data within zEpid
df = ze.load_sample_data(timevary=False)
 
#Creating polynomial terms
df['cd40sq'] = df['cd40']**2
df['cd40cu'] = df['cd40']**3
 
#Generating stabilized IPTW for ART as exposure
model = 'male + age0 + cd40 + cd40sq + cd40cu + dvl0'
df['iptw'] = ze.ipw.iptw(df,treatment='art',model_denominator=model,stabilized=True)
 
#Fitting a GEE model with the statsmodels library to obtain the risk of death by ART exposure (Risk Difference)
ind = sm.cov_struct.Independence()
f = sm.families.family.Binomial(sm.families.links.identity)
linrisk = smf.gee('dead ~ art',df['id'],df,cov_struct=ind,family=f,weights=df['iptw']).fit()
print(linrisk.summary())

​Which gives us the following results
​                               GEE Regression Results
===================================================================================
Dep. Variable:                        dead   No. Observations:                  547
Model:                                 GEE   No. clusters:                      547
Method:                        Generalized   Min. cluster size:                   1
                      Estimating Equations   Max. cluster size:                   1
Family:                           Binomial   Mean cluster size:                 1.0
Dependence structure:         Independence   Num. iterations:                     2
Date:                     Tue, 26 Jun 2018   Scale:                           1.000
Covariance type:                    robust   Time:                         13:56:22
==============================================================================
                 coef    std err          z      P>|z|      [0.025      0.975]
------------------------------------------------------------------------------
Intercept      0.1817      0.018     10.008      0.000       0.146       0.217
art           -0.0826      0.037     -2.205      0.027      -0.156      -0.009
==============================================================================
Skew:                          1.7574   Kurtosis:                       1.1278
Centered skew:                 0.0000   Centered kurtosis:             -3.0000
==============================================================================
You can visit the following website for a description on fitting a marginal structural model with an inverse probability weighted Kaplan Meier:
zEpid Docs – MSM with IPW-KM
​

For further description of the above features and others, a guide is available at http://zepid.readthedocs.io/en/latest/


Note: At the time of this blog post, we are on version 0.1.3
​

Download zEpid

You can download zEpid via GitHub, PyPI, or directly from the command line using
pip install zepid

In the background, zEpid uses:
  • NumPy
  • SciPy
  • pandas 
  • statsmodels 
  • matplotlib
  • tabulate
​If you are interested in conducting analyses in Python, I also recommend the packages:
  • lifelines (survival analysis tools) 
  • biopython (biological computation tools and search PubMed) 
  • seaborn (improved visualizations)
  • sas7bdat (read in SAS files)
  • sklearn (machine learning models)
  • NetworkX (network analysis)

zEpid - a Python library for epidemiology tools
For an introduction to Python intended for epidemiologists, I have a guide in development at https://github.com/pzivich/Python-for-Epidemiologists 

​Note that zEpid is distributed under the MIT license. ​


​Paul

About the Author
Paul Zivich - creator of zEpid - a Python library for epidemiology tools
 
Paul Zivich is an epidemiology PhD student at University of North Carolina at Chapel Hill. His interests include infectious disease epidemiology and causal inference in the presence of interference.
​
To request features or ask questions, contact him on GitHub at /pzivich/zepid, on Twitter @zEpidpy, or by email.
0 Comments

Your comment will be posted after it is approved.


Leave a Reply.

    Picture
    Picture

    Practical solutions for conducting great epidemiology methods. Transparency in code. Attitude of constant improvement.

    Appreciate my stuff?

    Picture

    Picture
    Picture
    Picture
    Picture

    Picture
    Picture

    All
    Bailey DeBarmore
    Data Visualization
    Excel
    IPW
    Paul Zivich
    P Values
    Python
    R
    Regression
    SAS
    Stata
    ZEpid


    Picture

    March 2021
    September 2020
    April 2019
    September 2018
    August 2018
    July 2018
    June 2018
    May 2018


    RSS Feed

BLOGS

Work & Productivity
Health and Nutrition
EPICODE

About

About Bailey
CV and Resume
CONTACT

RD EXAM

Study Smarter Method
RD Exam Resources

FIND ME ON

Facebook
LinkedIn
Twitter
Google Scholar
Research Gate
Terms & Conditions | Privacy Policy | Disclaimers
Copyright Bailey DeBarmore © 2020
  • Home
  • Productivity
    • Blog
    • My Recs
  • EPI
    • EPICODE
    • #EpiWritingChallenge >
      • About the EWC
      • All Posts
  • Wellness
    • Health Blog
    • My Recs
  • Freebies